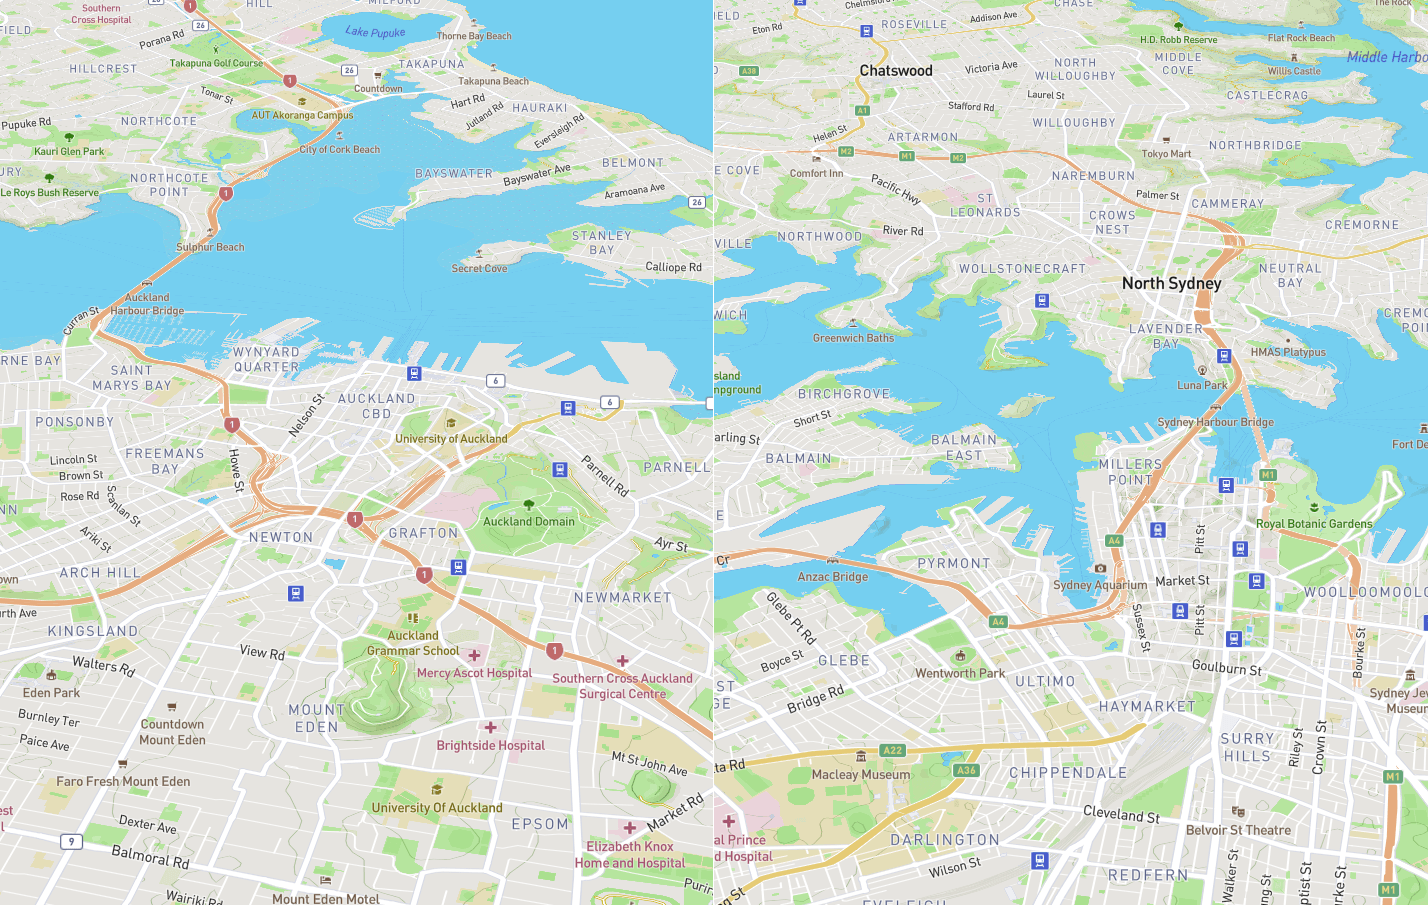
Every city is different, and those differences are reflected in our maps. I find it really interesting that our the differences in landscape and urban form manifest themselves in these maps, and it’s cool to be able to directly compare two cities side by side.

However, I’ve never been particularly happy with the tools that exist to do this. So I made one.
Why it’s better?
I think this is a huge improvement over other tools, as it uses vector maps. This means you can zoom to any fraction (no jump in zoom levels), rotate the maps, and even tilt in 3D. I’ve also thrown in an option to switch to a satellite view, so you can see some of the differences in land use.
You can also search for a location, to save you having to scroll around, and it works nicely on mobile too! I’ve also thrown in a few sample cities that I think are similar.
- Sydney & Auckland: Both coastal cities in Oceania, founded in a similar time period
- New York & Hong Kong: Both tiny, super dense island cities!
- Canberra & Washington, D.C.: Both planned federal capitals, created for similar reasons
Was it hard to make?
Not really! I did most of it in a morning. It was basically a matter of creating two Mapbox maps, and syncing the events between them.
The hardest part was syncing the zooms. Because of Web Mercator projection, the same zoom level at different latitudes doesn’t necessarily mean things will be the same scale. I spent (admittedly too much) time on coming up with an equation to translate the zoom levels between the two maps. If you’re curious, here’s the equation:
zoom2 = log2( |cos(lat2)| / |cos(lat1)| / 2zoom1 )
Other than that, it was pretty straightforward! The code is open source—you can go take a look over at https://github.com/consindo/samescale.
Is it finished?
Yes. It’s nice to actually be able to call a piece of software finished.